In-class Exercise 2: Tableau Hands-on Part 1
In this exercise, we have some hands-on on Tableau.
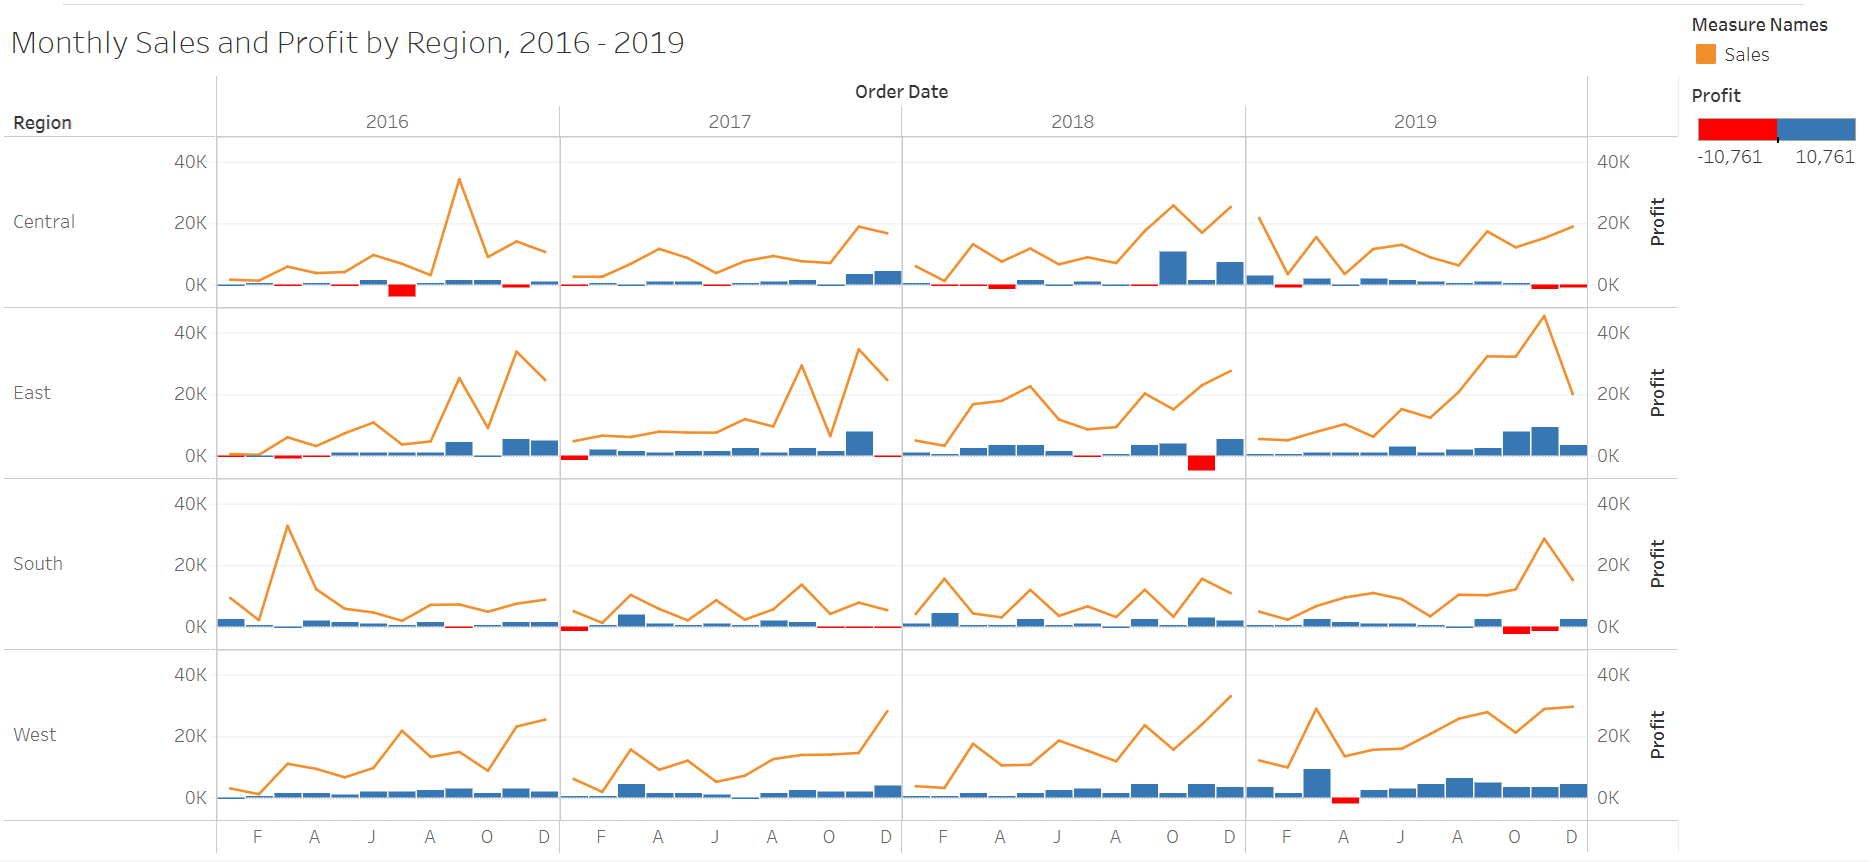
We have learned to plot lines and bar charts together by region and order date.
We used colour mark card to differentiate profit and loss.
This visualisation is published in Tableau Public which you can find it here.